The short version: The big 0–100 number in PageSpeed Insights is a lab test -- a single simulated visit on a throttled mid-range phone. It's useful for finding problems, but it isn't what Google uses to judge your site. What counts is the real-visitor data at the top of the report: the Core Web Vitals assessment. A 72 with passing Core Web Vitals is in better shape than a 95 with failing ones. Chase real-world speed, not a perfect number.
It's one of the most common questions I get from business owners: a screenshot of a PageSpeed Insights report, a red or orange number circled, and a one-line note -- "Is this bad?"
Sometimes it is. Often it isn't -- or at least not in the way they think. PageSpeed Insights is one of the most useful free tools Google offers, and also one of the most misread. Here's how to read it like someone who does this for a living.
Two Very Different Kinds of Data
When you test a page in PageSpeed Insights, the report has two sections that look similar but measure completely different things.
The top: field data (what real visitors experienced)
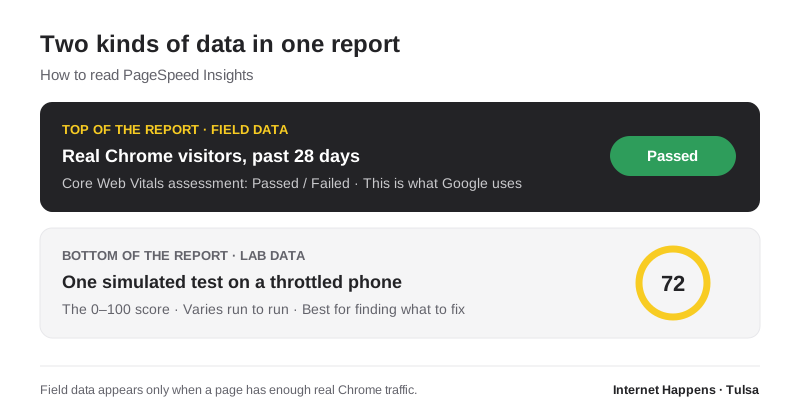
If your site gets enough traffic, the top of the report shows "Discover what your real users are experiencing." This comes from the Chrome User Experience Report -- anonymized data from real Chrome users who visited your page over the past 28 days. It shows your three Core Web Vitals and a simple verdict: passed or failed. This is the data Google uses as a page experience signal.
The bottom: lab data (one simulated test)
Below that is the familiar colored circle with a score from 0 to 100. That comes from Lighthouse, which loads your page once in a controlled environment -- for mobile, it simulates a mid-range phone on a slower connection. It's great for diagnosing problems because it's repeatable and shows exactly what's slowing the page down. But it's one simulated visit, not your real audience.
No field data? Smaller sites often don't have enough Chrome traffic to show real-user data. That's normal. In that case, the lab score is your best available guide -- just remember what it is.
What's Actually in the 0–100 Score
The Lighthouse performance score isn't a speed measurement. It's a weighted blend of five lab metrics, each converted to a score based on how it compares with real websites. According to Google's Lighthouse documentation, the current weights are:
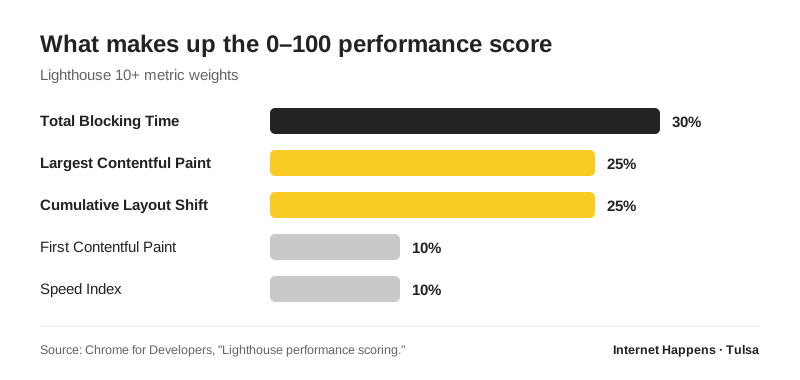
- Total Blocking Time (30%) -- how long the page is too busy running JavaScript to respond to a tap. Heavy scripts, page builders, and third-party widgets are the usual culprits.
- Largest Contentful Paint (25%) -- how quickly the main content (usually a hero image or headline) appears.
- Cumulative Layout Shift (25%) -- how much the layout jumps around as things load.
- First Contentful Paint (10%) -- when anything first appears.
- Speed Index (10%) -- how quickly the visible page fills in.
Google's documentation also points out that scores vary from run to run. Test the same page three times and you may get three different numbers. A swing of a few points means nothing. I saw it myself when I rebuilt my own site -- I talk about that honestly in why I moved my own site off WordPress.
What Google Actually Grades: Core Web Vitals
The pass/fail assessment at the top of the report is based on three Core Web Vitals, measured at the 75th percentile of real visits:
| Metric | What it measures | "Good" threshold |
|---|---|---|
| Largest Contentful Paint (LCP) | Loading | 2.5 seconds or less |
| Interaction to Next Paint (INP) | Responsiveness | 200 milliseconds or less |
| Cumulative Layout Shift (CLS) | Visual stability | 0.1 or less |
Notice that INP, the responsiveness metric, isn't in the lab score at all -- you can't measure how a page responds to real taps without real people tapping. Total Blocking Time is the lab stand-in for it. I go deeper on these thresholds in Modern Website Design Techniques for 2026.
How Much Does the Score Affect Rankings?
Less than most people fear. Google uses page experience signals, including Core Web Vitals, as part of its ranking systems -- but relevance and helpful content come first. A slow page with the best answer can outrank a fast page with a weak one.
Where speed really pays off is with people. A page that loads slowly on a phone, or jumps around just as someone goes to tap your phone number, loses customers regardless of where it ranks. That's the real reason to care.
How to Actually Use PageSpeed Insights
- Test your most important pages, not just the homepage. Your top service pages and contact page matter as much.
- Look at the top section first. If real-user Core Web Vitals pass, you're in good shape, whatever the circle says.
- Test on mobile. Most local customers are on phones, and Google indexes the mobile version of your site.
- Use the lab report as a to-do list. Scroll to the diagnostics and look for big items: oversized images, render-blocking scripts, third-party code, and elements that shift.
- Run it a few times. Look at the pattern, not one result.
- Watch the trend in Search Console. Its Core Web Vitals report groups your pages by real-user performance over time, which is more useful than any single test.
The Fixes That Usually Matter Most
- Images: resize them to the size they're displayed, use modern formats like WebP, set width and height, and never lazy-load the main hero image.
- Third-party scripts: chat widgets, heat maps, social embeds, and extra tracking pixels add up. Keep only the ones that earn their place.
- Heavy themes and page builders: often the biggest source of blocking JavaScript on small business sites.
- Fonts: load fewer font files and make sure text shows immediately rather than waiting.
- Hosting: a slow server makes everything else slower. Cheap hosting is rarely cheap in the long run.
Don't Chase 100
A perfect score is satisfying, but it's rarely the best use of your money. Going from 40 to 85 can make a noticeable difference to real customers. Going from 92 to 100 usually doesn't. Focus on passing Core Web Vitals on mobile, fix the obvious problems, and then put your time into content, reviews, and your Google Business Profile.
If your report is full of red and you're not sure what matters, send it my way. Performance work is part of every website design and SEO project I take on, and I'll tell you honestly which fixes are worth doing.